Tavid uses cookies to ensure website functionality and improve your user experience. Collecting data from cookies helps us provide the best experience for you, keeps your account secure and allows us to personalise advert content. You can find out more in our cookie policy.
Please select what cookies you allow us to use
Cookies are small files of letters and digits downloaded and saved on your computer or another device (for instance, a mobile phone, a tablet) and saved in your browser while you visit a website. They can be used to track the pages you visit on the website, save the information you enter or remember your preferences such as language settings as long as you’re browsing the website.
Cookie usage
Necessary cookies
| Cookie name | Cookie description | Cookie duration |
|---|---|---|
| tavex_cookie_consent | Stores cookie consent options selected | 60 weeks |
| tavex_customer | Tavex customer ID | 30 days |
| wp-wpml_current_language | Stores selected language | 1 day |
| AWSALB | AWS ALB sticky session cookie | 6 days |
| AWSALBCORS | AWS ALB sticky session cookie | 6 days |
| NO_CACHE | Used to disable page caching | 1 day |
| PHPSESSID | Identifier for PHP session | Session |
| latest_news | Helps to keep notifications relevant by storing the latest news shown | 29 days |
| latest_news_flash | Helps to keep notifications relevant by storing the latest news shown | 29 days |
| tavex_recently_viewed_products | List of recently viewed products | 1 day |
| tavex_compare_amount | Number of items in product comparison view | 1 day |
Preference cookies
| Cookie name | Cookie description | Cookie duration |
|---|---|---|
| chart-widget-tab-*-*-* | Remembers last chart options (i.e currency, time period, etc) | 29 days |
| archive_layout | Stores selected product layout on category pages | 1 day |
Targeting cookies
| Cookie name | Cookie description | Cookie duration |
|---|---|---|
| cartstack.com-* | Used for tracking abandoned shopping carts | 1 year |
| _omappvp | Used by OptinMonster for determining new vs. returning visitors. Expires in 11 years | 11 years |
| _omappvs | Used by OptinMonster for determining when a new visitor becomes a returning visitor | Session |
| om* | Used by OptinMonster to track interactions with campaigns | Persistent |
Analytical cookies
| Cookie name | Cookie description | Cookie duration |
|---|---|---|
| _ga | Used to distinguish users | 2 years |
| _gid | Used to distinguish users | 24 hours |
| _ga_* | Used to persist session state | 2 years |
| _gac_* | Contains campaign related information | 90 days |
| _gat_gtag_* | Used to throttle request rate | 1 minute |
| _fbc | Facebook advertisement cookie | 2 years |
| _fbp | Facebook cookie for distinguishing unique users | 2 years |
CNBC: Gold's golden cross: The metal just formed a chart pattern that can signal a breakout
Published by Kirke Sööt in category Financial news on 23.05.2017
Gold price (XAU-EUR)
3 506,53 EUR/oz
- 52,78 EUR
Silver price (XAG-EUR)
50,01 EUR/oz
- 1,11 EUR
Gina Francolla , Fred Imbert
CNBC, 22 May 2017
- Gold’s 50-day moving average rose above its 200-day moving average on Monday, a bullish chart signal.
- When the shorter-term 50-day moving average crosses above the longer-term 200-day moving average a “golden cross” is formed.
Gold is up nearly 10 percent this year and might be primed for more gains if a signal tracked by technical analysts triggered Monday is any guide.
A small gain was enough to push the metal’s 50-day moving average price above the average price of the last 200 days, forming what’s known as a “golden cross” in technical analysis circles. This is seen as a positive signal that demonstrates an asset is outperforming so well in the short-term that it may reverse a longer term downtrend.
Gold since Feb. 6 with 50-day and 200-day moving averages:
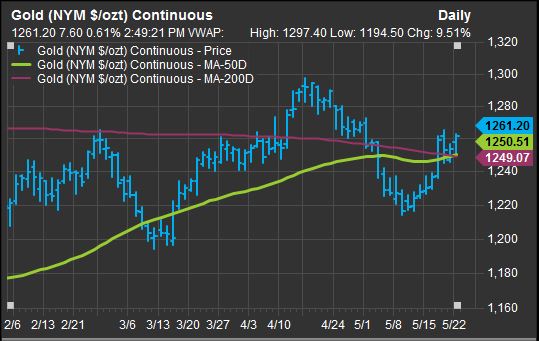
Source: FactSet
Gold futures for June delivery rose 0.62 percent, or $7.80, to settle at $1,261.40 per ounce Monday, adding to its already strong yearly performance. The precious metal is outperforming the S&P 500 index, which is up more than 6.5 percent, as investors hedge against the possibility that the Trump administration does not succeed in pushing through its pro-growth agenda.
To be sure, some technical analysts believer there’s more work to be done before this is a true gold breakout.
“In my humble opinion, gold remains in a tight jam,” forming a so-called pennant pattern between a 16-year rising support level and a falling six-year resistance level, said Chris Kimble, founder of Kimble Charting Solutions, in a note.
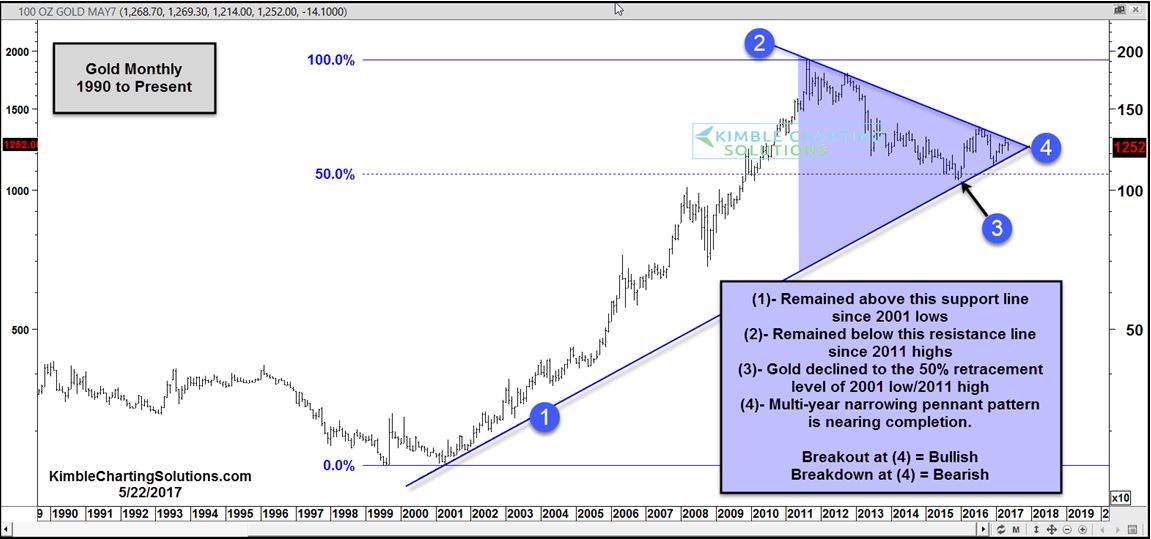
“Pennant patterns tend to frustrate both bulls and bears, as little net progress is made, [and] only quick traders make money in this pattern,” he said. “Pennant patterns don’t suggest which direction any asset will take. They do historically suggest that when the breakout/breakdown takes place, it is usually a big one.”
Gold price (XAU-EUR)
3 506,53 EUR/oz
- 52,78 EUR
Silver price (XAG-EUR)
50,01 EUR/oz
- 1,11 EUR


